
The Secretary Problem Part Two
Published:
Before reading this, it’s important to have an understanding of The Secretary Problem, which is detailed in my previous post The Secretary Problem.
Now, suppose that we don’t just rank them from 1 to $n$ where $n$ is the number of candidates. Instead, we generate $n$ samples from a the Standard Normal Distribution. It’s highly likely that all values should be distinct, so the nature of the problem remains the same. By simulating candidates from the Standard Normal, we are able to see the effectiveness of this algorithm in choosing optimal candidates. The asymptotic probability of selecting the optimal candidates is only $\dfrac{1}{e}$, and so it is important to show that this algorithm still selects strong candidates.
From the first post, we know that the optimal $k$ number of candidates to skip is $\lfloor \dfrac{n}{e} \rfloor$, and so we will use that algorithm. This post will be by no means as in depth as the previous, so the code is presented as is.
sims <- 10000
candidates <- 1000
k <- floor(candidates/2.718)
score <-c()

for(sim_i in 1:sims) {
  x <- rnorm(candidates)
  init_best <- max(x[1:k])
  for(i in (k+1):candidates) {
    score[sim_i] <- 0
    if (x[i] > init_best) {
      score[sim_i] <- x[i]
      break
    }
  }
}
plot(1:sims, score, xlab = "Sim Number",
     ylab = "Candidate Score",
     main = "The Secretary Problem: Candidate Scoring")
First, define the number of simulations and candidates, and then initialize a collection of scores. Finally, simulate the Secretary Problem with the chosen skipping algorithm and observe the score of the selected candidate.
The code results in the plot below.
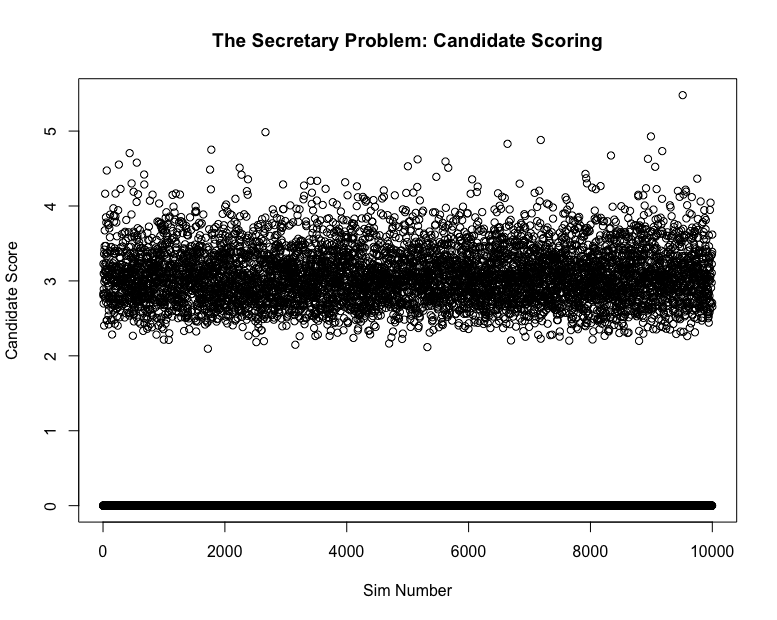
It’s clear that the majority of candidate are around 3 standard deviations from the mean, which means that most candidates will be in the top 98%. If we include the observations when the manager doesn’t hire anyone, the expected candidate score is approximately 1.94. If we exclude the cases where a candidate is not hired, then we have
In the simulation, the probability of not hiring a candidate at all is $.3689$ which intuitively makes sense because the probability that the best candidate is within the skipped candidates should also be $\dfrac{1}{e}$.
So, in conclusion, the Secretary Problem results in the $\dfrac{n}{e}$ skip algorithm that still results in choosing candidates in the top 99% when candidates are actually chosen, which happens $\dfrac{e-1}{e}$ percent of the time.